
Whenever I facilitated whole day of maths training, one of the outdoor activities would involve looking at information handling outside. As one participant said, “We’ve always done traffic surveys, but that’s it.”
Now the beauty of information handling outside is that even meagre concrete jungles can provide multiple opportunities. The challenge is to think what could be observed, recorded and displayed using the environment and resources. Below is an example from one twilight training session:
The teachers who work with our youngest children in P1-3 decided to measure the puddles! After all this is what children enjoy playing in when outside. They found three puddles and measured the length of these puddles using these 30cm sticks. As you can see, one puddle was particularly wide!
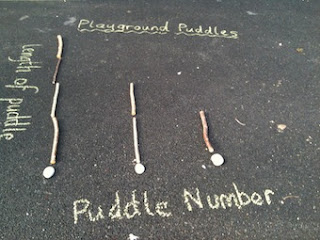
This led naturally onto discussions about the size of a puddle and how it can be measured. For example one puddle was about half a stick, so there’s an element of rounding required. For more able children the stick lengths can be added together and the width in metres recorded! One task with several outcomes is always welcome 🙂
The teachers working with children around P4/5 level (Yr 3/4 in England) went on a gathering exercise. Below is a tally chart of the objects found. I like the visual representation of the actual objects…
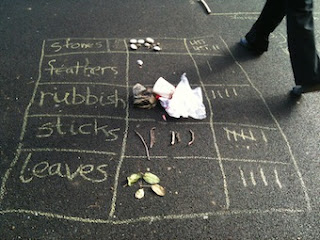
Initially the group had chosen a pictogram to represent the quantities but in the end they opted for a line graph. If a skipping rope or any other rope had been available then this could have been used as the line – handy if it needs adjusting!
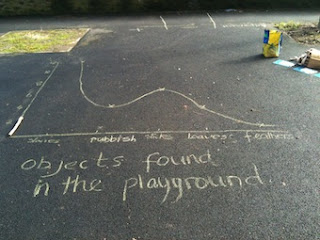
The P6/7 teachers got very caught up in the actual collecting of their information. Using the trees they could see, they opted to compare the height of the tree (measured by peering through their legs) with the width of the tree measured in handspans at that point. It’s easier to demonstrate than explain, but here’s their representation…

The P3-ish group of teachers were tired and needed a springboard idea, so I gave them a Carroll diagram as a prompt as there were some stones and gravel nearby. Children have a lot of fun creating their own criteria for Carroll diagrams, once they get the jist of what’s expected.

The same teachers applied their knowledge to Venn Diagrams. It’s hard to tell from the photo below but all the stones have numbers on them. One hoop has multiples of 2, the other multiples of 5 and in the middle are multiples of 2 and 5. Hoops can be used instead of chalk circles.

Below is a De Bono’s PMI chart or “Plus, Minus, Interesting” chart. This is handy for reviewing an activity. In turns, the children stand behind any of the variables and give their point of view. If one child is already in the “Plus” then he or she steps back to allow the next child to face the rest of the class to speak. This act in itself creates a simple graph.

The pedantics reading this post may have realised that these graphs are not perfect. Some are roughly drawn. Others lack the presentation standards expected in a jotter such as the title in the right place and the acknowledgement of the X and Y axis. However teachers, like children, learn experientially and sometimes need to just do an activity in order to reflect and review. The ideas here sow the seeds of many more to come. We discussed when and how to bring in the attention to detail such as the accurate use of scale and other curriculum requirements.
What is interesting is the variety of subject matter in such a “barren” space. Often it’s very much about viewing the potential of what is there rather than grieving the absence of what is not there! I think these teachers proved this rather well, don’t you?
Many thanks to all the participants for their thoughts, ideas and energy during this training session.
This blog post was originally published in April 2012.


Some great ideas here that could be very easily replicated in any school yard. Tomorrow, I intend to attack our playground with some chalk and create some guerrilla graphs for children to fill in at the leisure!
Oooh- I love the idea of guerrilla graphs! What a great phrase!
this is brilliant, what an inspiring way to teach and learn about graphs!
great way to learn data handling
Thanks Annemarie – It does take a bit of practice – the first few times children can be all over the place because it’s much more challenging than using a graph package on a computer….!